Browser Debugging from PyCharm
Browser Debugging from PyCharm
We’ve seen browserless debugging in Node. Later we’ll see using a fake DOM, to keep browserless a little longer. But sometimes you really do need to run in a browser. Sure is a shame that you have to lose PyCharm as a debugging environment.
But you don’t! In this section we show the JetBrains IDE Support extension for Chrome. With it you can debug JavaScript, from PyCharm, but which is running in Chrome.
Overview
- Setup the JetBrains IDE Support extension for Chrome
- Start a debug session that uses it
About the Chrome Extension
When working with HTML and JavaScript from your IDE, you really want to avoid switching to a browser and hitting reload, then looking for print output in the console. JetBrains provides a Chrome extension which lets PyCharm remote-control the Chrome browser, under IDE control.
This applies to live editing HTML: you make some changes and the browser updates, which we also saw in Browser Bundling with Webpack. It also applies to JavaScript: you can run a debug session, where the interpreter is in Chrome, but you stay in the IDE for all of your debugging.
Installation
The page above provides more detail, but in summary, you first install the Chrome extension from the Google App Store. You can also just start a debug session and you will get prompted to install, but doing it manually is more explicit.
Start Debugging
Imagine we have an HTML file:
<!DOCTYPE html>
<html>
<head>
    <title>Debugging in Chrome</title>
</head>
<body>
<h1>Debugging in Chrome</h1>
<script src="app.js"></script>
</body>
</html>
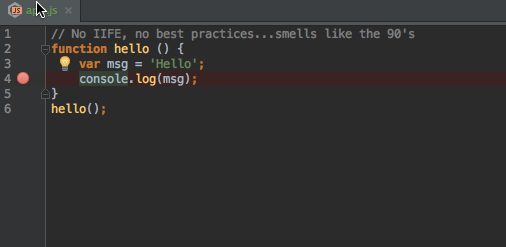
...which loads some JavaScript:
// No IIFE, no best practices...smells like the 90's
function hello () {
    var msg = 'Hello';
    console.log(msg);
}
hello();
We’d like to jump into debugging when the browser gets to the console.log
line. We could always put the debugger keyword there, or use the Chrome
debugger. But we’d like to stay in our IDE and not context-switch.
It’s surprisingly simple. First, in your app.js, click in the left gutter
to set a breakpoint one the line you’d like to stop at:
Next, right-click on the tab for index.html and choose
Debug 'index.html' from the context-menu. Your Chrome browser will open
in the background with a notice saying:
"JetBrains IDE Support" is debugging this browser
From your perspective, though, the IDE is still focused and you are in the debugger:
Note
You can’t have the Chrome dev tools window open for the tab that is being used by the JetBrains IDE Support plugin. You will get a friendly warning telling you to close the tools.
Wrapup
While not as seamless as full, browserless TDD, this is still a big step up from the traditional reload cycle. You stay “in context”, in your IDE, and use the tools and techniques you’ve already mastered.